How to Check VPS RAM Usage via SSH
To Check VPS RAM Usage via SSH, you can use various command-line tools available in Linux. Checking the RAM usage of your Virtual Private Server (VPS) via SSH is a common task for system administrators. Here’s a step-by-step guide to help you do that:
Check Overall VPS RAM Usage
The free command displays the total amount of free and used physical and swap memory in the system, as well as the buffers and caches used by the kernel.
Once you’re logged into your VPS via SSH, you can check the overall RAM usage using the free command:
free -mThis command will display memory usage statistics in megabytes (MB). You’ll see output similar to this:
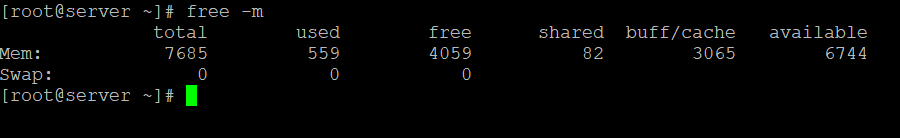
Here, “total” represents the total amount of RAM, “used” represents the amount of RAM currently in use, and “free” represents the amount of RAM currently available for use.
If you add -m or -g after the command, you will get the stats displayed in MB or GB correspondingly. In the modern versions of the free tool you can also use -h, and the tool will automatically use the most convenient units, like this:

Check Process-Specific RAM Usage
If you want to check the RAM usage of specific processes, you can use the top command. The top command provides an interactive real-time view of system processes and their resource usage, including memory.
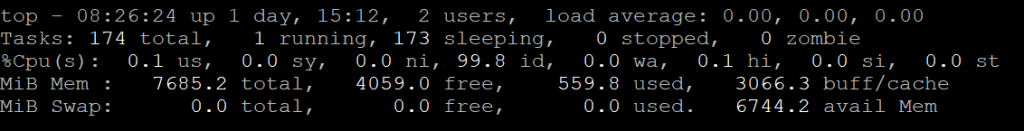
Type top in your SSH terminal and press Enter.
topThis command will display a dynamic view of system processes, including their CPU and memory usage. Press Shift + M to sort processes by memory usage, with the highest memory-consuming processes listed at the top.
Use htop for a More User-Friendly Interface
Alternatively, you can use htop, a more user-friendly alternative to top. Install it if it’s not already available on your system, and then run:
htopThis command presents system metrics in a colorized and interactive format, making it easier to interpret than top.
Check RAM Usage Trends
The vmstat command reports information about processes, memory, paging, block IO, traps, and CPU activity. To monitor RAM usage trends over time, you can use tool vmstat. These tools provide historical data on system resource usage, allowing you to identify patterns and potential issues. Here is an example of the output:
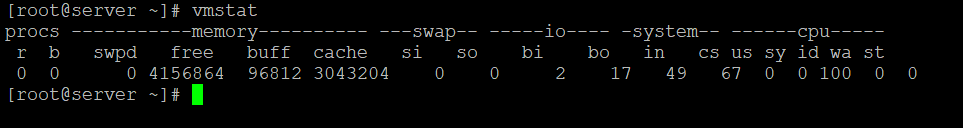
The first two lines provide the information on the organization of the table.
Procs shows information about processes: r means the number of processes running or waiting for run time, b means processes sleeping.
Memory section: swpd shows virtual memory used, free shows idle memory, buff and cache display memory allocated to buffers and cache correspondingly.
Two values in the swap section display amounts of data swapped to (si) and from (so) disk per second. Two values in the IO section show Input/Output stats for the drive: received from (bi) and sent to (bo) it.
In the system section in stands for interrupts per second, and cs is the abbreviation for context switches.
CPU shows percentages of processor usage:
us: usage by user-launched code as opposed to system processes.
sy: usage by the actual system kernel
id: idle CPU time
wa: time spent waiting for Input/Output
st: time stolen from a virtual machine.